

Nuclear Power for Missions Beyond the Grid
Mobile Nuclear Operational Energy for Defense, Construction, Remote Infrastructure, and Off-Grid Resilience
DEFENSE PHYSICS LABORATORY, INC
Deploying Mission Assurance Physics Architectures for U.S. Strategic Deterrence
Reducing Power Constraints
Across Grid Independent Missions
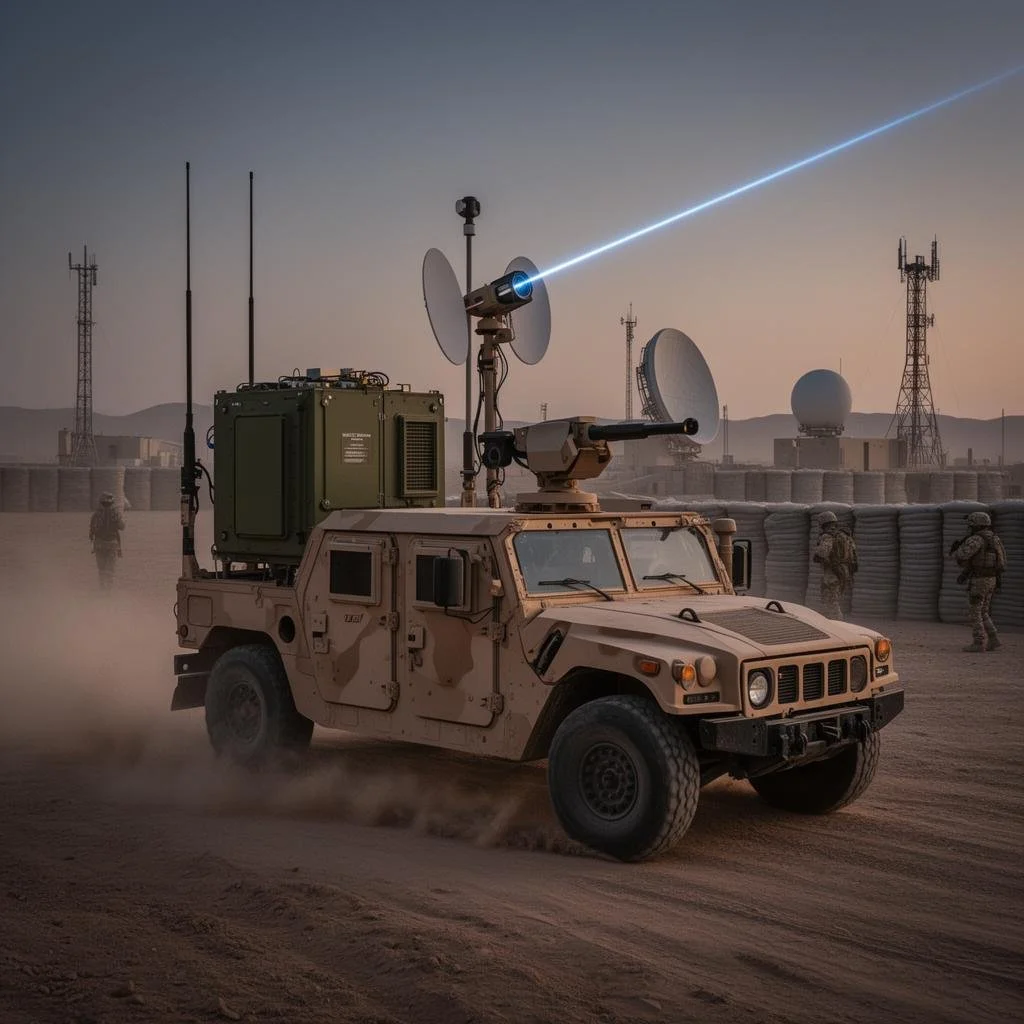
UMR-50 (Electric power up to 50 kW per unit)
Tactical Power for High Energy Mobile Vehicles
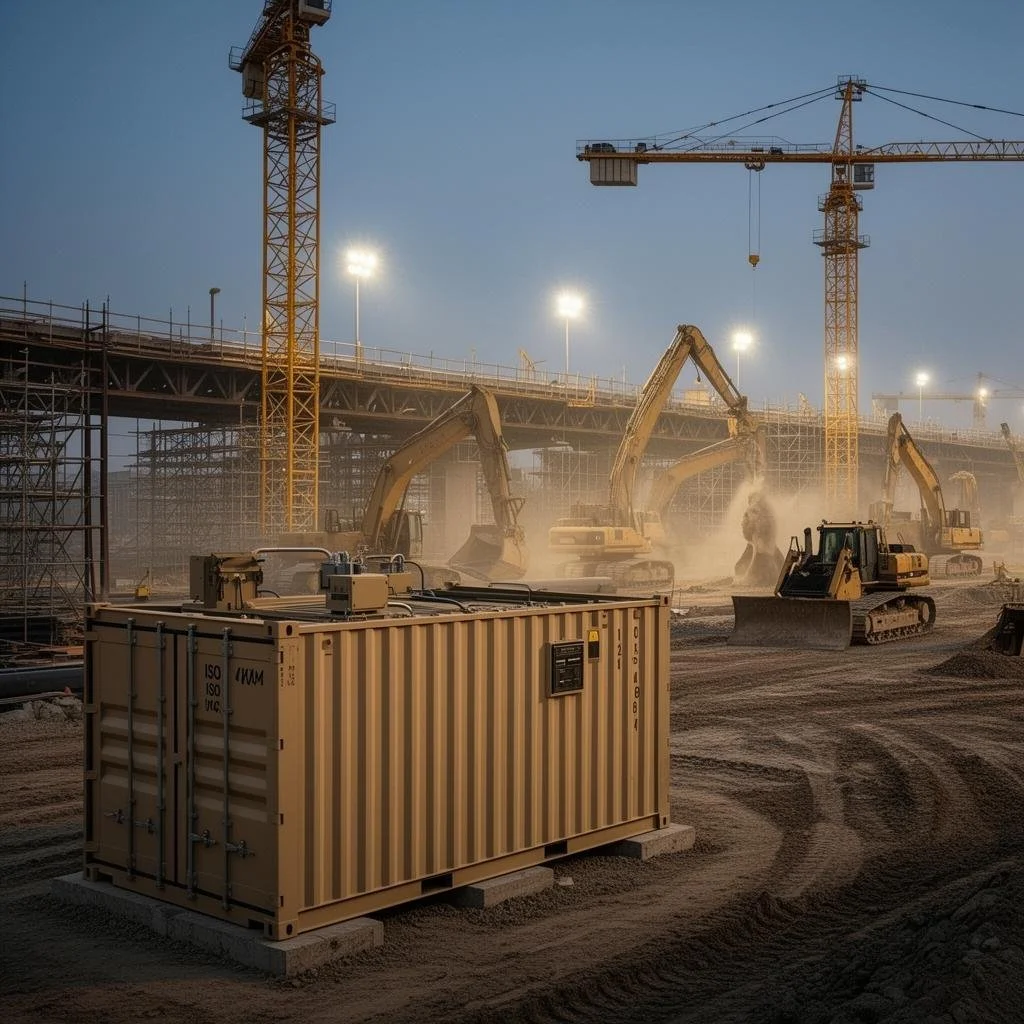
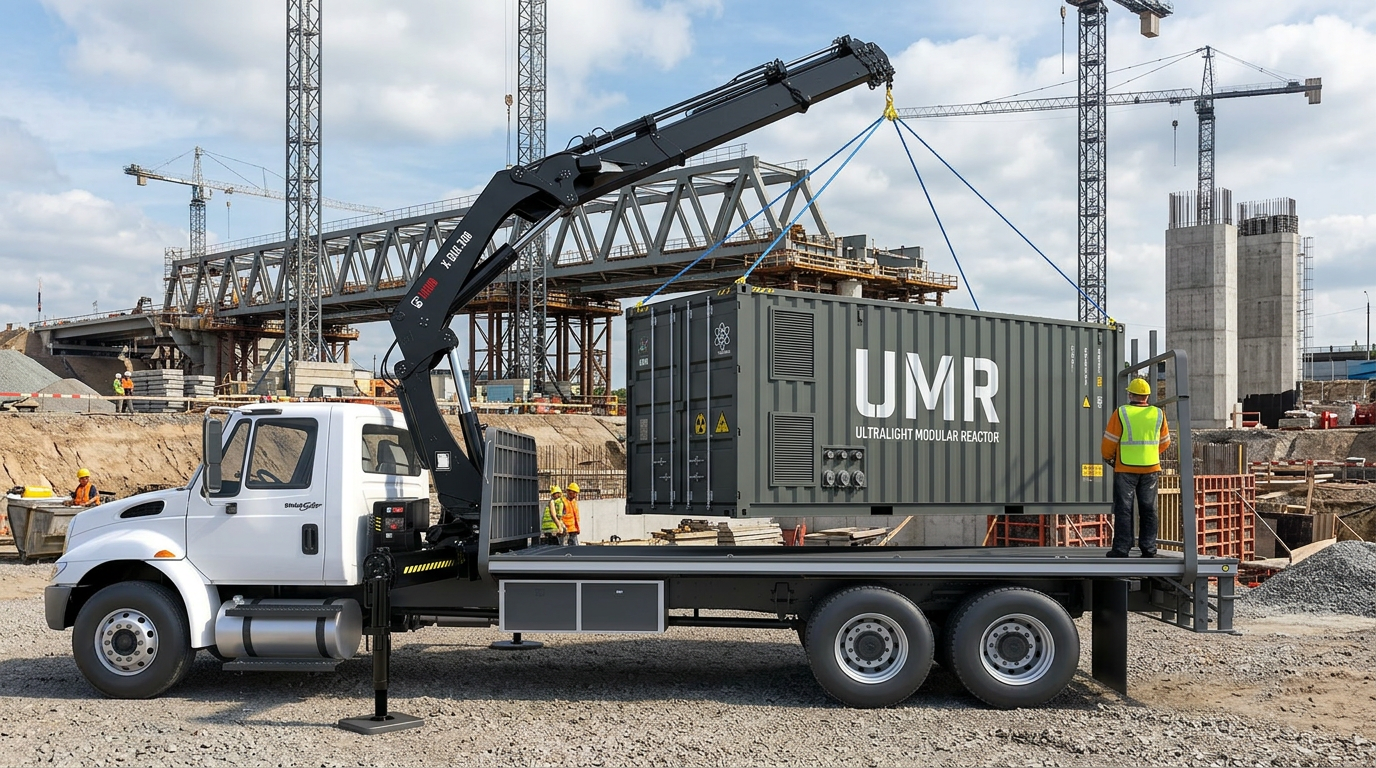
Temporary Power for Construction, Mining Sites
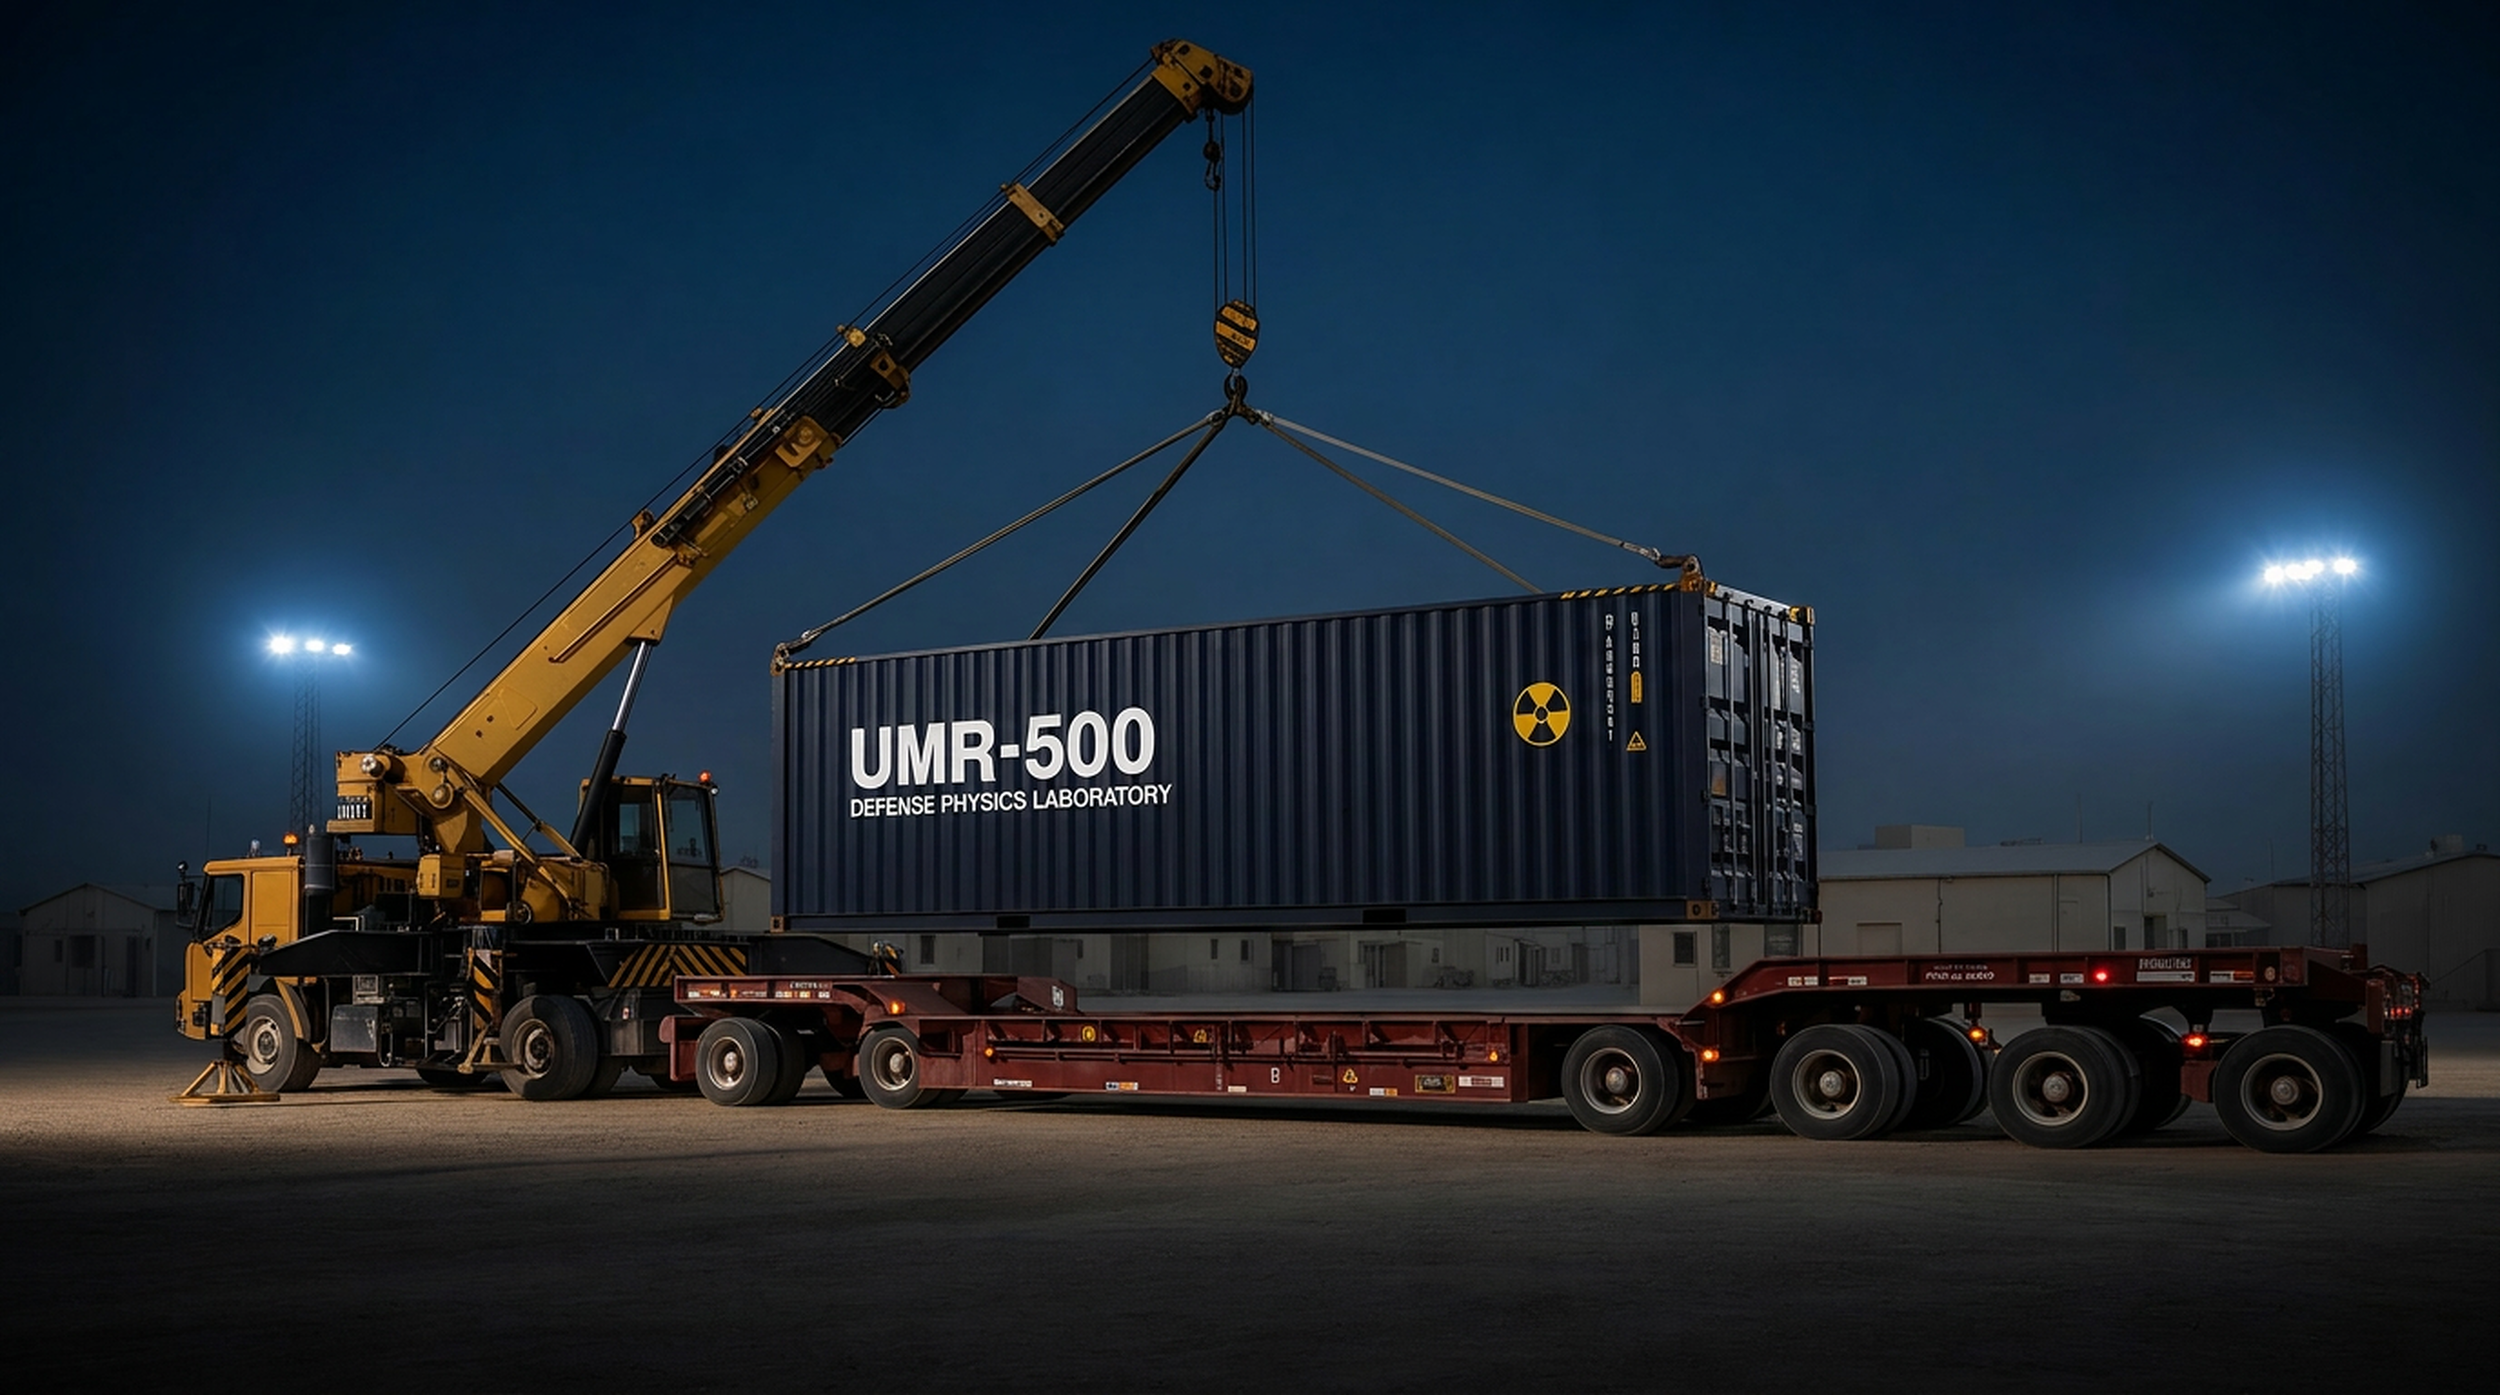
UMR-500 (Electric power up to 500 kW per unit)
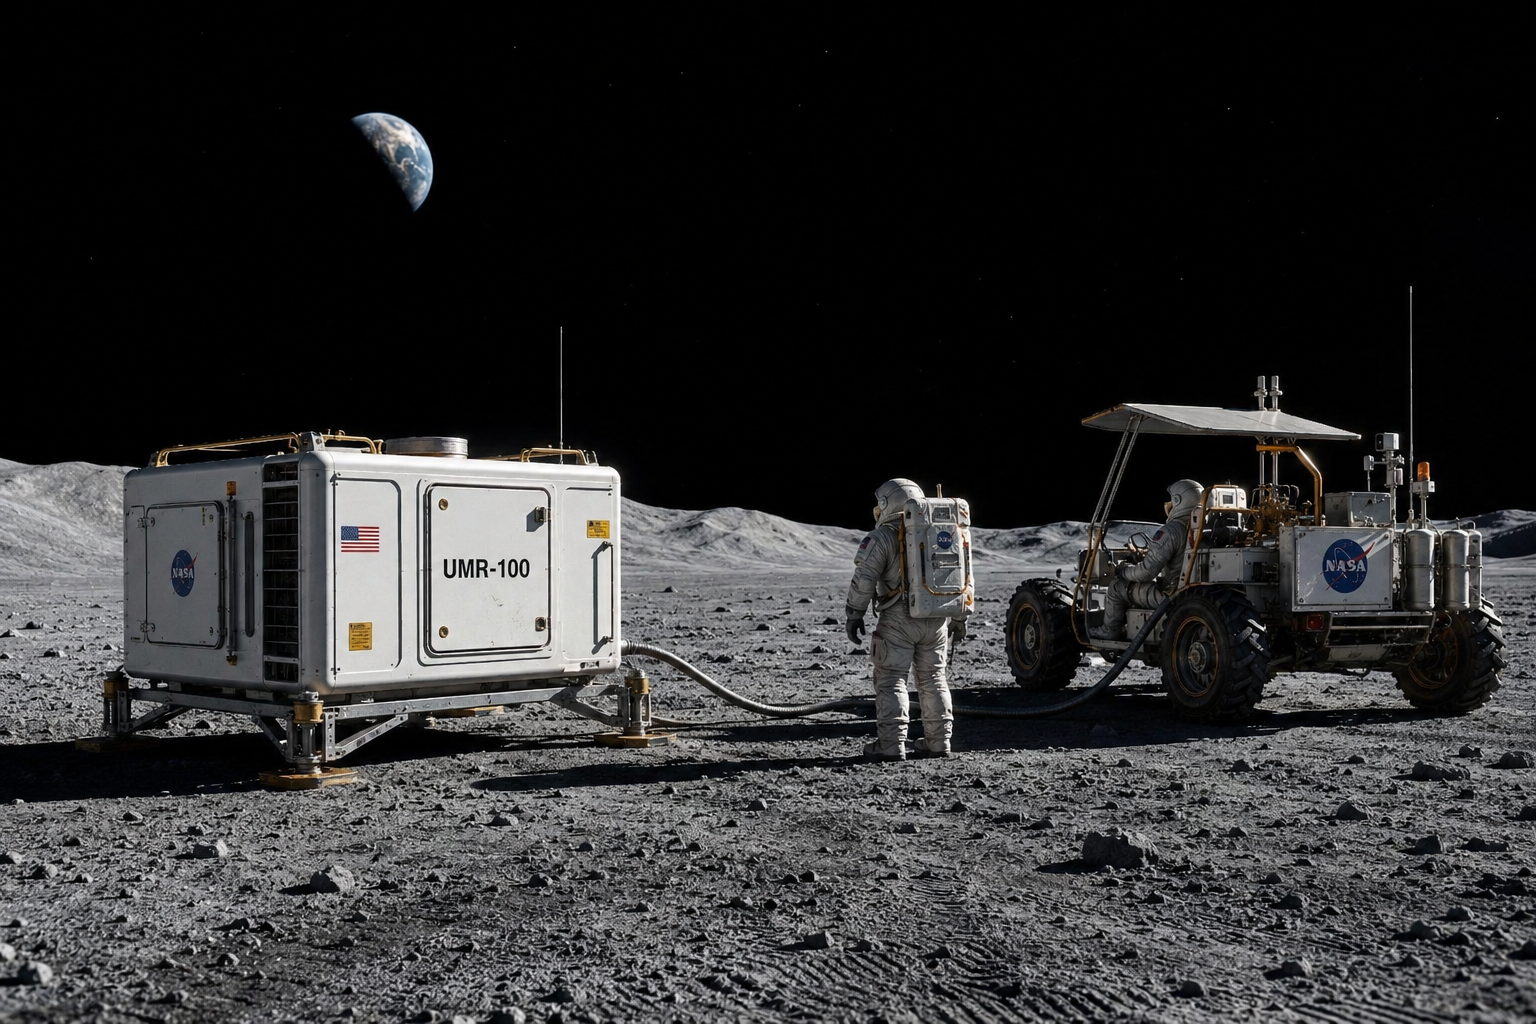
UMR-100 (Electric power up to 100 kW per unit)
Resilient Power for Space Exploration
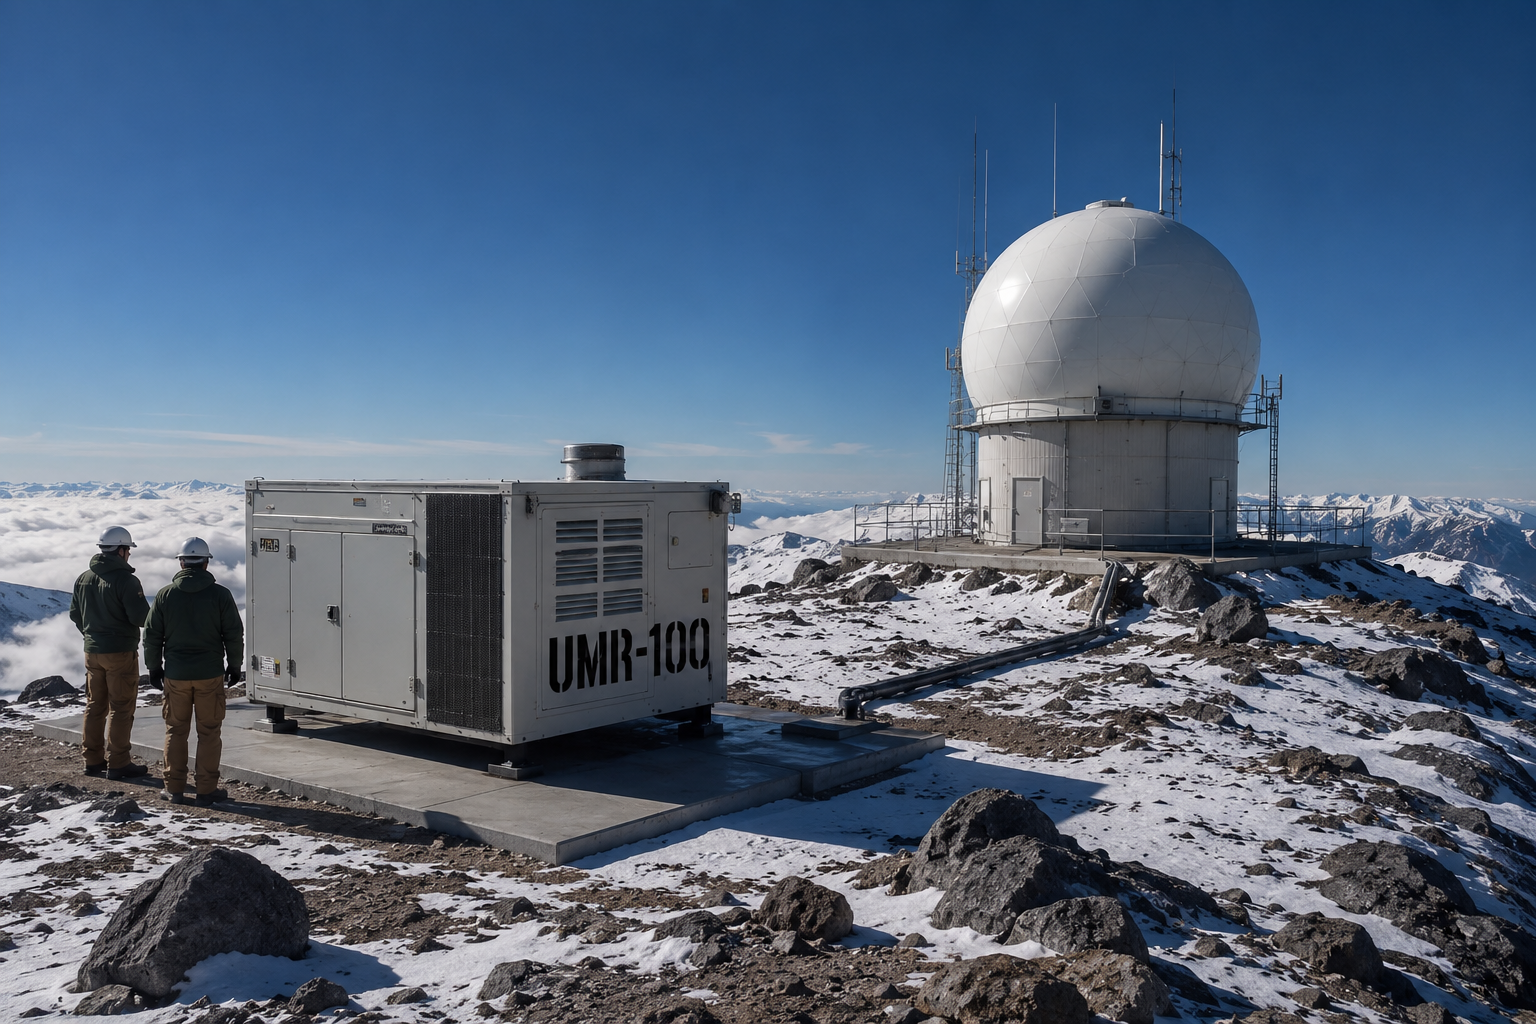
UMR-100 (Electric power up to 100 kW per unit)
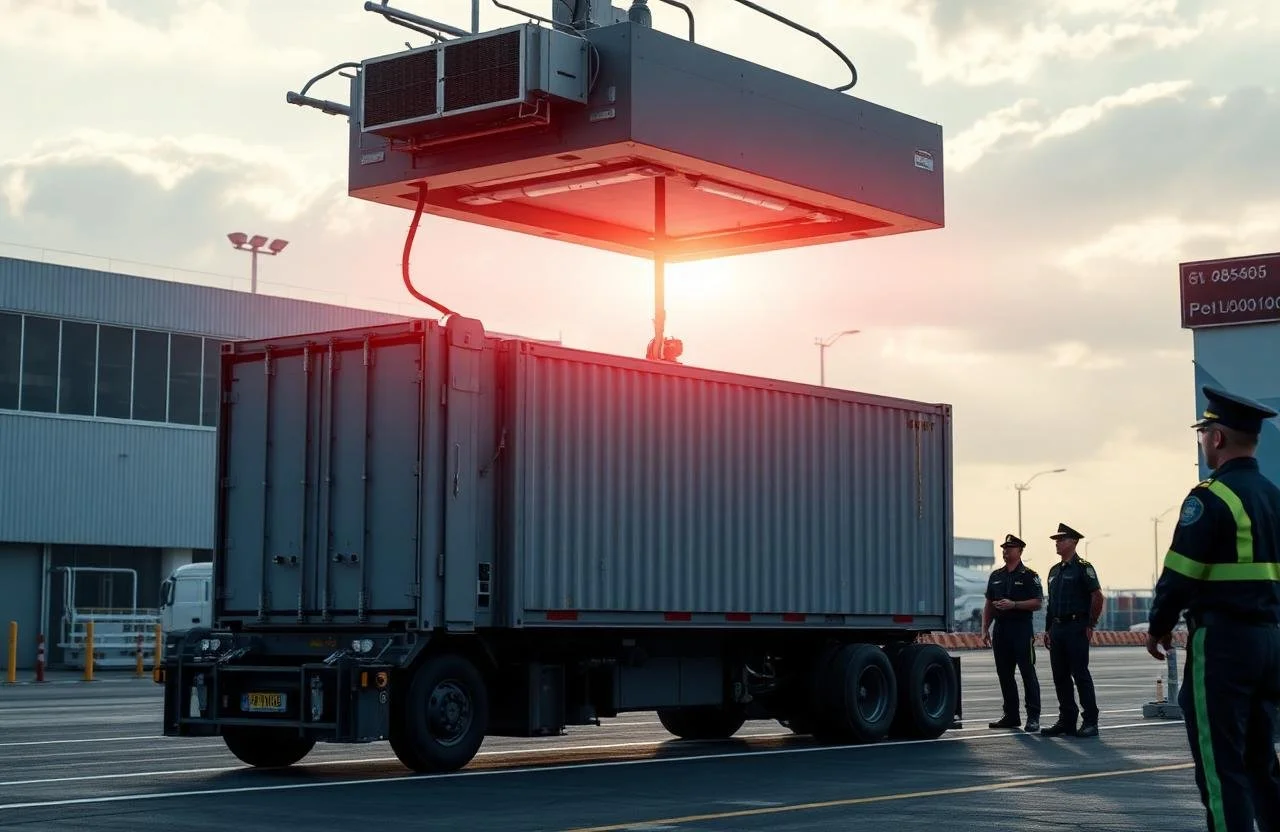
Remote Power for Critical Infrastructure
UMR-100 (Electric power up to 100 kW per unit)
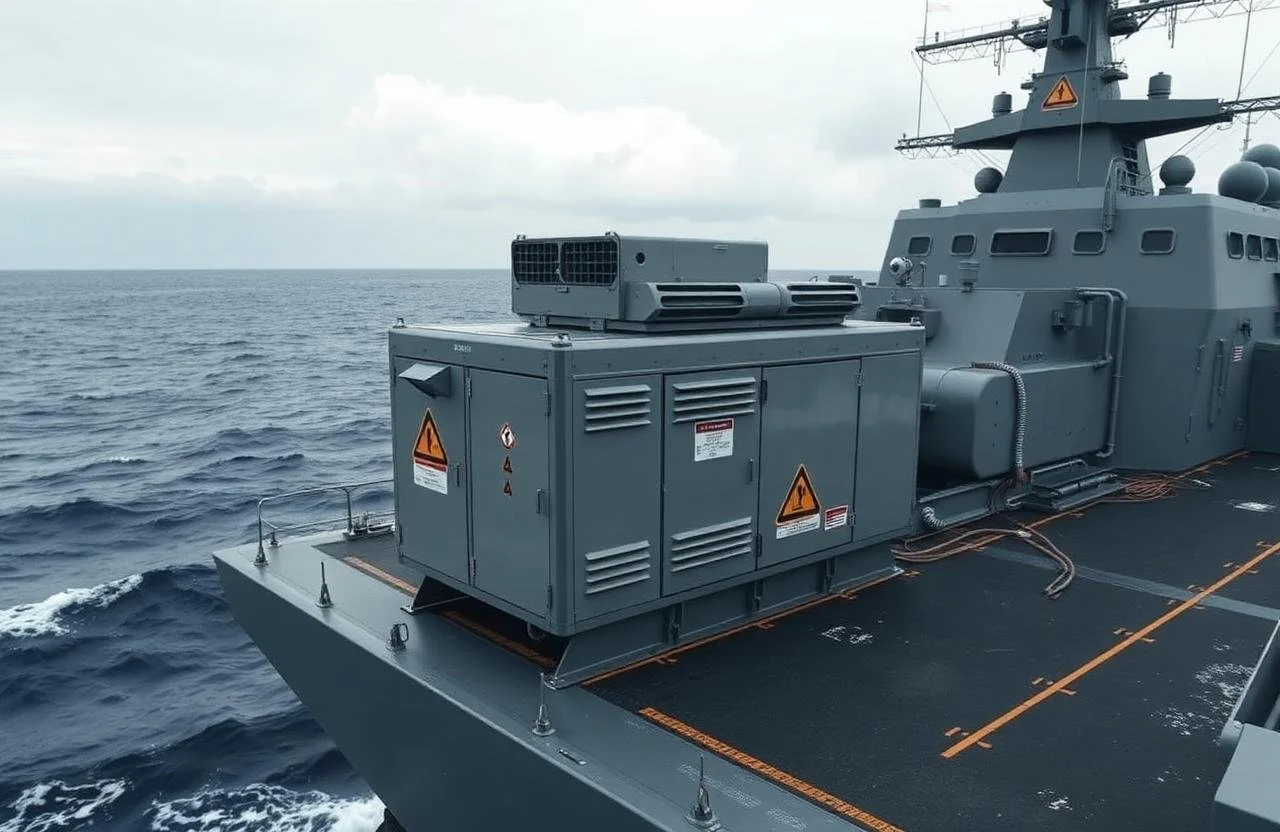
Endurance Power for Naval Missions
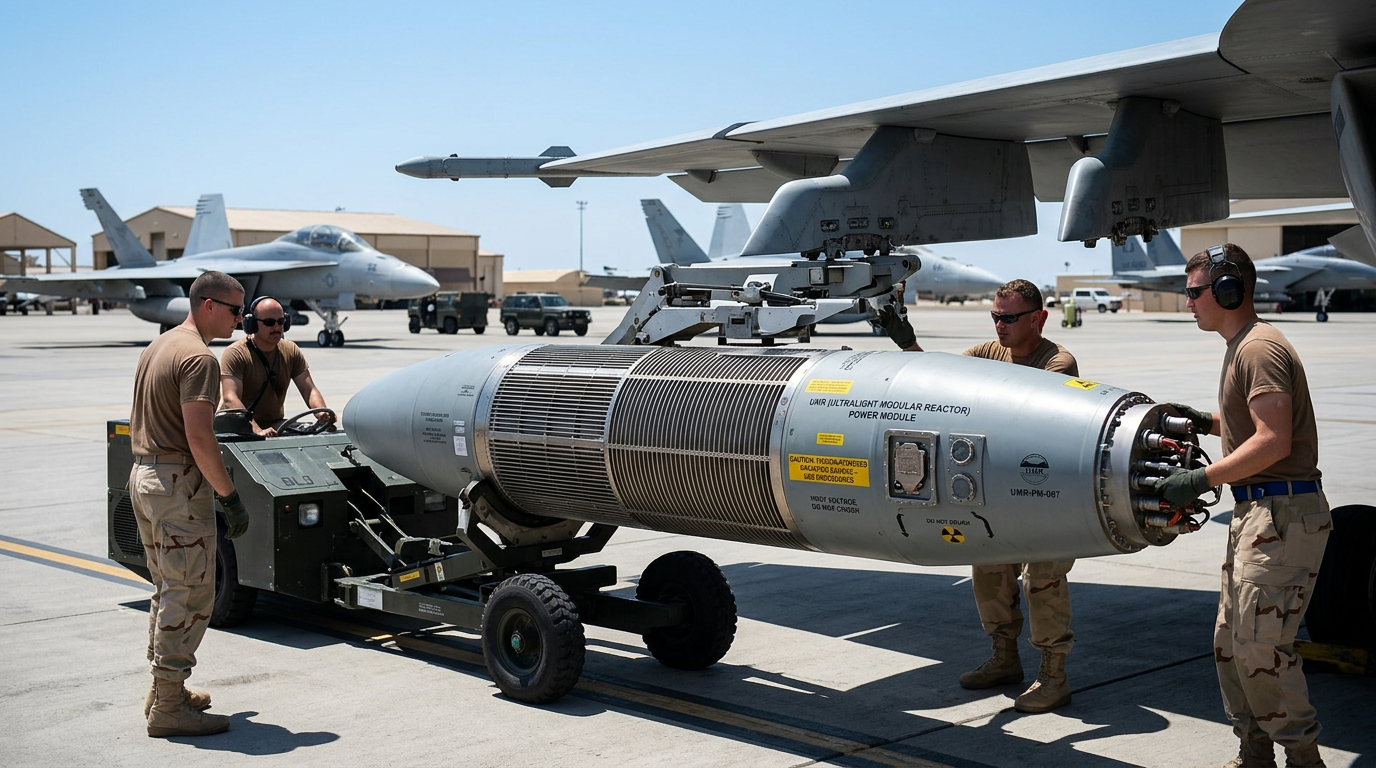
Aerospace Power for Avionics and Propulsion
UMR-10 (Electric power up to 10 kWe per unit)
Countering National Security Threats
Through Strategic Nuclear Capabilities

Weapons and Contraband Detection
UMR-N35 (Forensic up to 35 m³ per unit)
Nuclear Waste Treatment and Isotope Production
UMR-N75 (Irradiation up to 75 m³ per unit)
Nuclear Forensics and Homeland Security
UMR-N500 (Forensic up to 500 m³ per unit )
Commercialization Pathway
-
Completion of the prototype architecture for non-nuclear testing of the reactor; government endorsements (State and Federal); R&D infrastructure establishment with in Princeton NJ, and establishment of relations with the Department of Defense, the Department of Energy, and the Department of Homeland Security.
-
Initiate the non-nuclear testing program in Princeton; collaborative research with Princeton University, Princeton Plasma Physics Laboratory, U.S. Army, U.S. Air Force, DARPA, CUNY, FRIB, and other industrial and academic partners; start the licensing application process with the Nuclear Regulatory Commission.
-
Establish and initiate fast-tracked reactor testing program(s) with the U.S. Military through pilot deployment pathway(s); procure feasible nuclear fuel and its logistics (HALEU UO2/UN); begin intensive engineering operation for designing the early production model(s).
-
Completion of the prototype reactor testing at U.S. Military bases and other civilian demonstration sites, approval by the U.S. Department of Energy, and licensing with the U.S. Nuclear Regulatory Commission, complete early production facility, deliver first 10 reactors to users.
CURRENT
$1M
Pre-Seed
8 Months
$6M
Seed
2 Years
$12M
Series-A
2 Years
Financial Projections Per Unit
For one reactor generating 100 kW of continuous electricity
$300K / Year
RECURRING REVENUE
800 MWh
ANNUAL ENERGY DELIVERED
$120K / Year
MAINTENANCE
$1M
MANUFACTURING
$2.1M / Unit
10-YEAR CASH FLOW
$210K / Year
GROSS PROFIT
21%
IRR
$229K / Unit
NPV (12%)
Annual Estimate By Production Scale
Annual Production vs. $ Millions USD
DISCLAIMER: The financial information, operating assumptions, and projected return metrics set forth above are preliminary, illustrative in nature, and subject to revision. They are presented solely for the purpose of demonstrating the organization’s current target economic model and indicative NPV and IRR framework. Such figures do not constitute final pricing, final cost estimates, audited financial projections, or a guarantee of future performance. Actual results may differ materially depending on technical development, manufacturing scale, logistics, regulatory requirements, market conditions, availability of incentives, and other factors. Nothing contained herein shall be deemed a representation, warranty, or commitment that any projected economic performance, return profile, or financial outcome will be realized.